US Welfare Spending History from 1900
In 1902 governments in the United States spent very little on relief of the poor, including less than 0.2 percent on relief and 0.25 percent on health care services. In the early 21st century, governments spend over 8 percent of GDP on welfare programs, including health care for the poor.
A Century of Welfare Spending
Welfare spending began its ascent during the Great Depression.

Chart
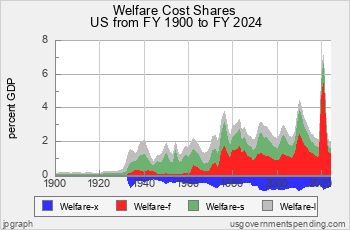
2.61: Welfare Spending in 20th Century
Welfare spending started out at the beginning of the 20th century at 0.2 percent of Gross Domestic Product (GDP). It was not until crisis of the Great Depression that welfare expenditures began their rise, reaching 2 percent of GDP by 1940.
During World War II, welfare expenditures declined to about one percent of GDP per year, and fluctuated between one and two percent per year, depending on the business cycle. Health care expenditure amounted to about one percent of GDP. By the early 1960s, welfare cost about two percent of GDP, and health cost about one percent of GDP.
Chart Key:
- Transfer to state and local

- Federal direct spending

- State direct spending

- Local direct spending
The Great Society programs started welfare on an upward path, so that after 1980 welfare spending fluctuated between 3 and 4 percent of GDP. The joint federal-state Medicaid program, health care for the poor that began in the 1960s grew steadily, reaching one percent of GDP in the recession year of 1991. By 2005 Medicaid exceeded 2 percent and is expected to reach 3 percent of GDP by 2015. Other state and local health care expenditures cost about one percent of GDP, so that in the recession year of 2010 total expenditures on welfare, including all health care expenditures, reached over 8 percent of GDP.
Government Health Spending on the Poor
Governments spent up to one percent of GDP on health care for the poor until the 1960s. Now the total is reaching 4 percent of GDP. (This excludes Medicare, the federal health program for senior citizens.)
Chart
2.62: Medicaid and Government Health Care
Health care expenditures by governments, mainly state and local, began the 20th century at about 0.25 percent of GDP. By 1960, after a temporary decline in World War II, expenditures had reached about one percent of GDP. The joint federal-state Medicaid program began in the 1960s and increased steadily, year after year, and is expected to reach 3 percent of GDP by 2015. Other health care expenditures (mainly state and local) reached 1.25 percent of GDP in the early 1980s and have remained at that level ever since.
Governments Sharing the Cost of the Poor
When government spending on welfare began to expand in the Great Depression, it was mainly a state and local affair. But in the 1960s the federal government got into welfare in a big way.
Chart
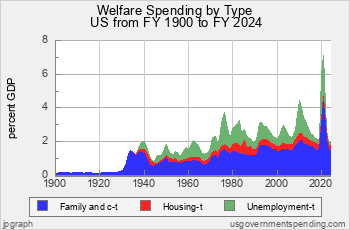
2.63: Welfare Cost by Government Share
Prior to the Great Depression, non-health care expenditures on the poor were minimal, less than 0.2 percent of GDP. But in the Great Depression state and local governments sharply increased spending on welfare, with an initial boost from the federal government, and expenditures reached 2 percent of GDP in 1940. Between 1940 and 1960 welfare was mainly borne by state governments, with total cost fluctuating between 1 and 2 percent of GDP including a 0.5 percent contribution from the federal government.
In the 1960s the federal government started to dominate welfare spending, contributing about half of the 4 percent of GDP cost by the early 1980s and about two-thirds of the 5 percent of GDP cost in the Great Recession in 2010.
No comments:
Post a Comment